P/E ratio and valuation basics: what a share's price is paying for
How many rupees you pay for each rupee a company earns
Figures checked 2026-10-31
The P/E ratio tells you how many rupees you’re paying for each rupee a company earns in a year. P/E stands for price-to-earnings. It’s the most quoted valuation number in investing, and one of the most misread.
Start with earnings per share. A company’s profit is shared across all its shares. Divide the year’s profit by the number of shares and you get EPS, earnings per share. It’s how much of the profit belongs to one share.
Then the P/E. Divide the share price by the EPS. That’s the P/E ratio.
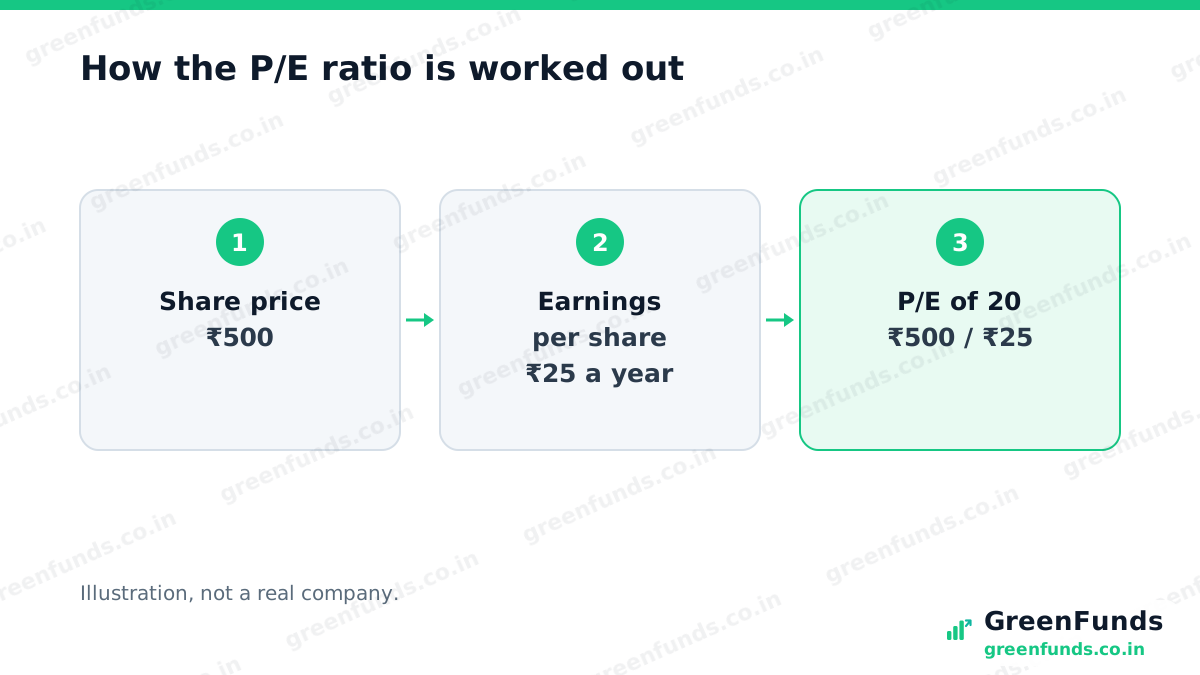
A worked example (illustration). Say a made-up company earns a profit of 100 crore rupees this year and has 4 crore shares. Its EPS is 25 rupees. If the share trades at 500 rupees, the P/E is 20. In plain words, buyers are paying 20 rupees today for each rupee the company earns in a year. If profits stayed exactly the same, it would take about 20 years of earnings to add up to the price.
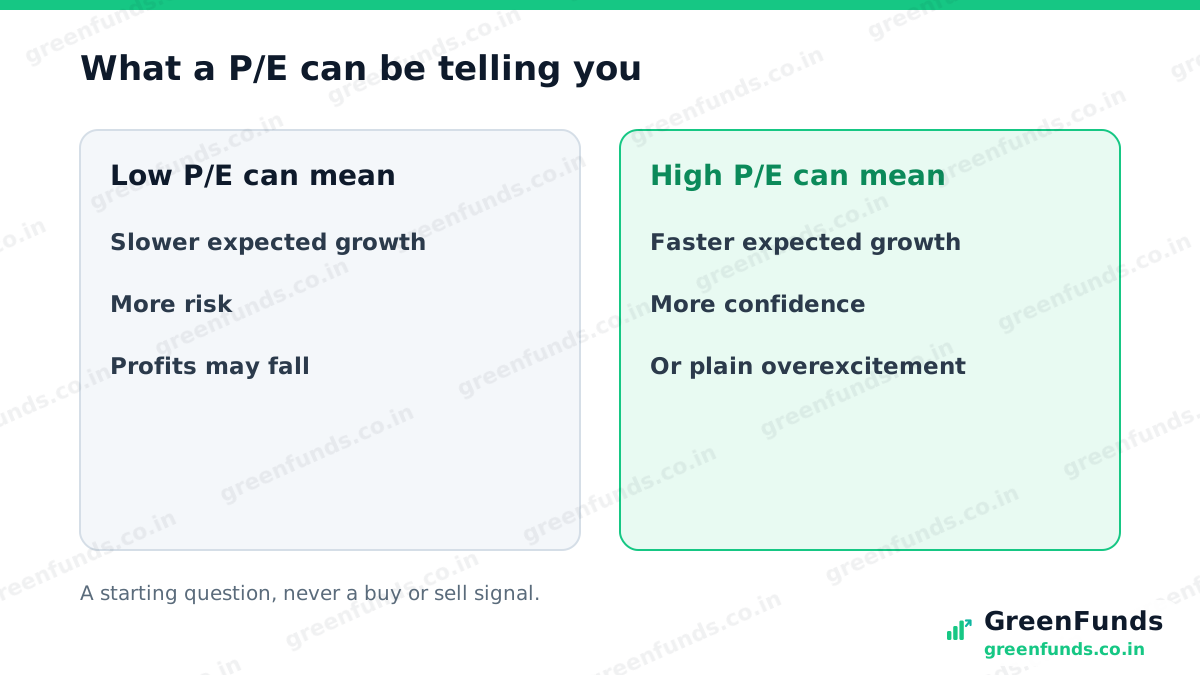
What the number is really saying. A P/E is the market’s mood about the future, squeezed into one figure. People pay a high P/E when they expect profits to grow fast. They pay a low P/E when they expect slow growth, see more risk, or doubt the profits will last.
Did you know? A falling share price lowers the P/E, but falling profits raise it. So a company whose profits suddenly drop can show a jump in P/E even as its share price falls. That’s one reason a P/E on its own can point you the wrong way. Always ask what’s happening to the earnings, not just the ratio.
Why “low P/E” isn’t the same as “cheap”. This is the trap. A share can look cheap on P/E because the market thinks its profits are about to shrink. If that happens, the low P/E was a warning, not a bargain. Equally, a high P/E isn’t automatically expensive if profits really do grow fast. The number is a starting question, not an answer.
Compare like with like. P/E works best between similar companies in the same industry, over similar periods. Industries grow at different speeds and carry different risks, so their usual P/E levels differ. You’ll also see a P/E for a whole index, which gives a rough sense of how pricey the market is overall compared with its own past.
The takeaway. P/E is price divided by earnings per share: how much you pay for each rupee of profit. It reflects what the market expects, so a low P/E can be a warning and a high one can be justified. Use it to ask better questions, never as a buy or sell signal on its own.
More to read: how share prices move, investing vs trading, and what is the stock market.
Questions people ask
What is the P/E ratio?
The P/E, or price-to-earnings, ratio is a share's price divided by the company's earnings per share over a year. It tells you how many rupees you're paying for each rupee of yearly profit. A share at 500 rupees with earnings of 25 rupees per share has a P/E of 20.
What is EPS?
EPS, or earnings per share, is a company's profit for the year divided by the number of its shares. It shows how much profit belongs to each single share. It is the E in the P/E ratio.
Is a low P/E share always cheap?
No. A low P/E can mean the market expects profits to fall, sees more risk, or doubts the earnings will last. A high P/E can mean the market expects strong growth, or that people are overexcited. The number starts a question; it doesn't answer it.
Can I compare P/E ratios across any two companies?
It works best between similar companies in the same industry. Different industries grow at different speeds and carry different risks, so their usual P/E levels differ. Comparing a bank with a software company on P/E alone can mislead.
Sources
- P/E and EPS figures in this lesson All companies and numbers are made-up illustrations, not real companies. Calculated as price divided by earnings per share.